Github Link
https://github.com/Natan-Asrat/tensorflow_building_sequential_models
Contact
- LinkedIn: Natan Asrat
- Gmail: nathanyilmaasrat@gmail.com
- Telegram: Natan Asrat
- X: Natan Asrat Yilma
- Youtube: Natville
The Setup
The project starts by loading the Fashion-MNIST dataset, which contains 70,000 clothing images. The pixel values are scaled for better training, and a Pandas DataFrame is set up to track the model’s progress.
Libraries Used
- TensorFlow Keras
- Matplotlib
- Numpy
- Pandas
Imports
Python
import tensorflow as tf
from tensorflow.keras.preprocessing import image
from tensorflow.keras.models import Sequential
from tensorflow.keras.layers import Dense, Flatten, Conv2D, MaxPooling2D
import matplotlib.pyplot as plt
import numpy as np
import pandas as pd
Dataset
Python
fashion_mnist_data = tf.keras.datasets.fashion_mnist
(train_images, train_labels), (test_images, test_labels) = fashion_mnist_data.load_data()
Labels
Python
labels = [
    'T-shirt/top',
    'Trouser',
    'Pullover',
    'Dress',
    'Coat',
    'Sandal',
    'Shirt',
    'Sneaker',
    'Bag',
    'Ankle boot'
]
Rescale Images
Rescale the image values so that they lie in between 0 and 1.
Python
train_images = train_images / 255
test_images = test_images / 255
The Core Code
Define the Model
Python
model = Sequential([
    Conv2D(16, kernel_size=3, padding='SAME', input_shape=(28,28,1)),
    MaxPooling2D(pool_size=3),
    Flatten(),
    Dense(10, activation='softmax')
])
Compile the Model
Python
model.compile(
    optimizer='adam',
    loss='sparse_categorical_crossentropy',
    metrics=['accuracy', 'mae']
)
Fit the model
Python
history = model.fit(train_images[..., np.newaxis], train_labels, epochs=8, batch_size=256)
The Analysis
Plot the Training History
Python
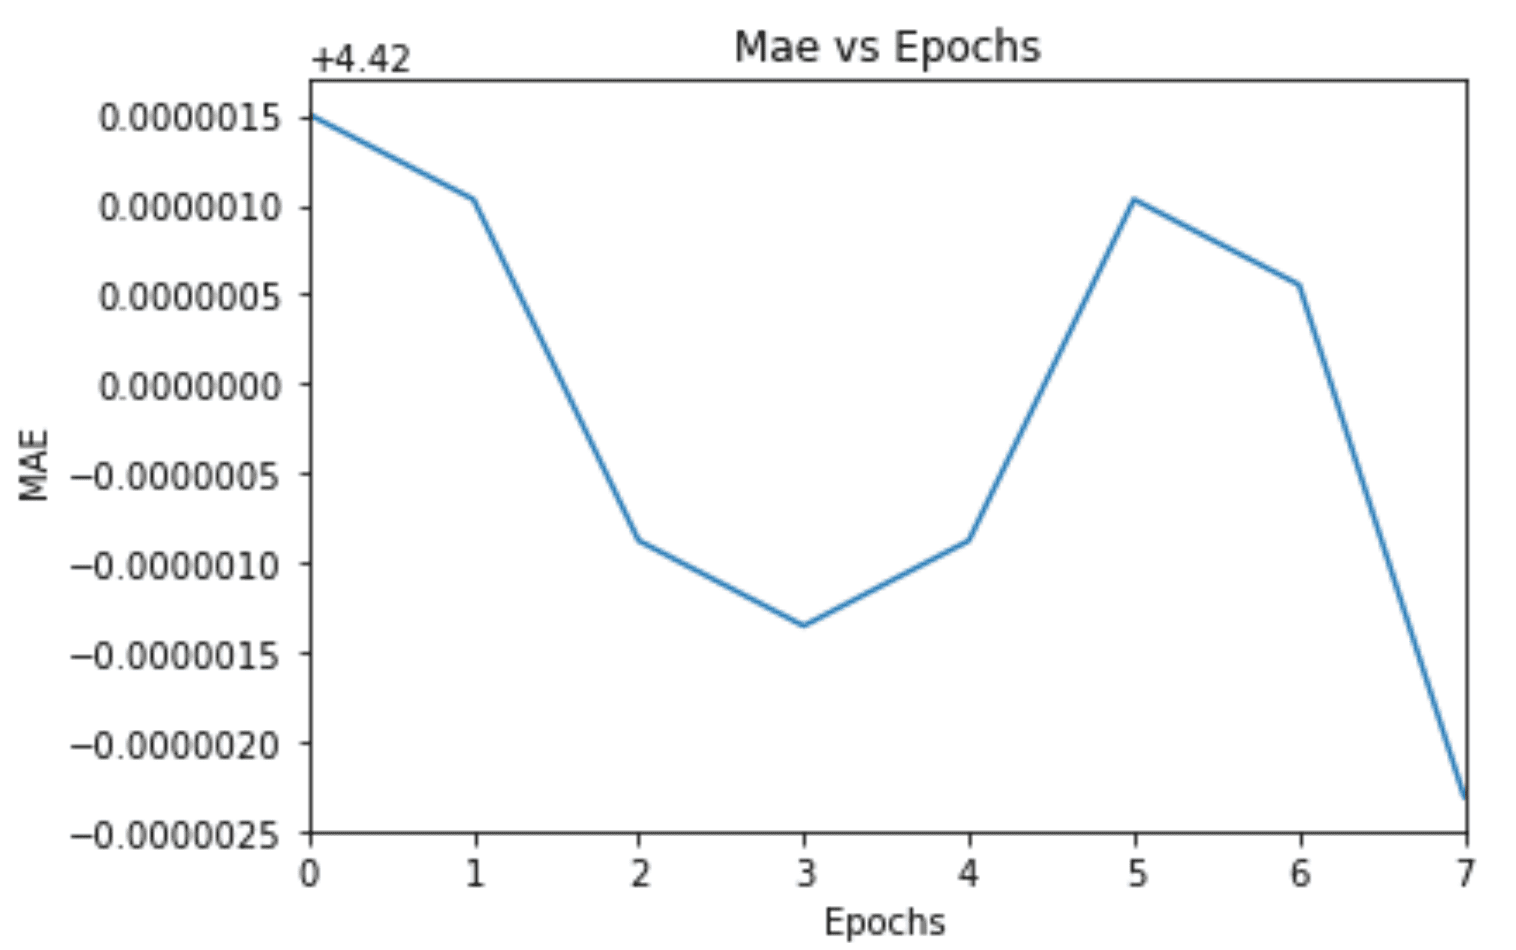
df = pd.DataFrame(history.history)
df.head()
Plot Loss vs Epochs
Python
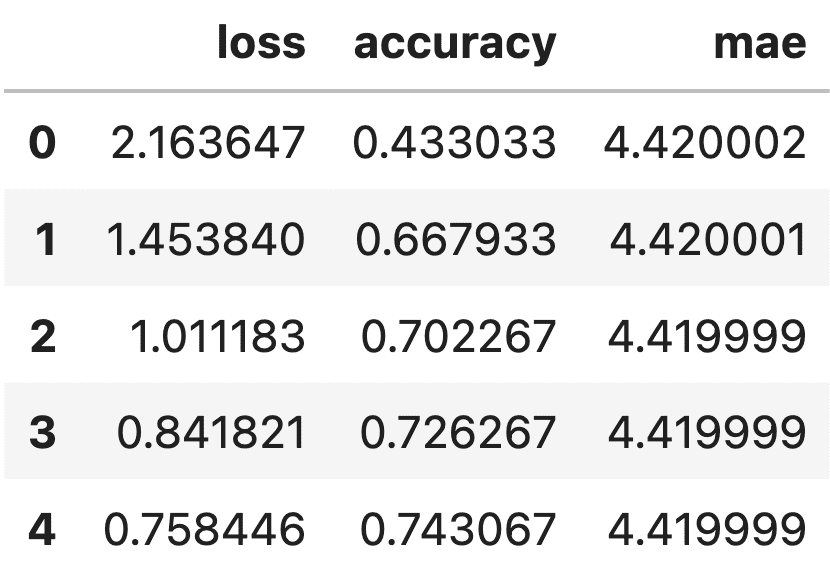
loss_plot = df.plot(y="loss", title="Loss vs Epochs", legend=False)
loss_plot.set(xlabel="Epochs", ylabel="Loss")
Plot Accuracy vs Epochs
Python
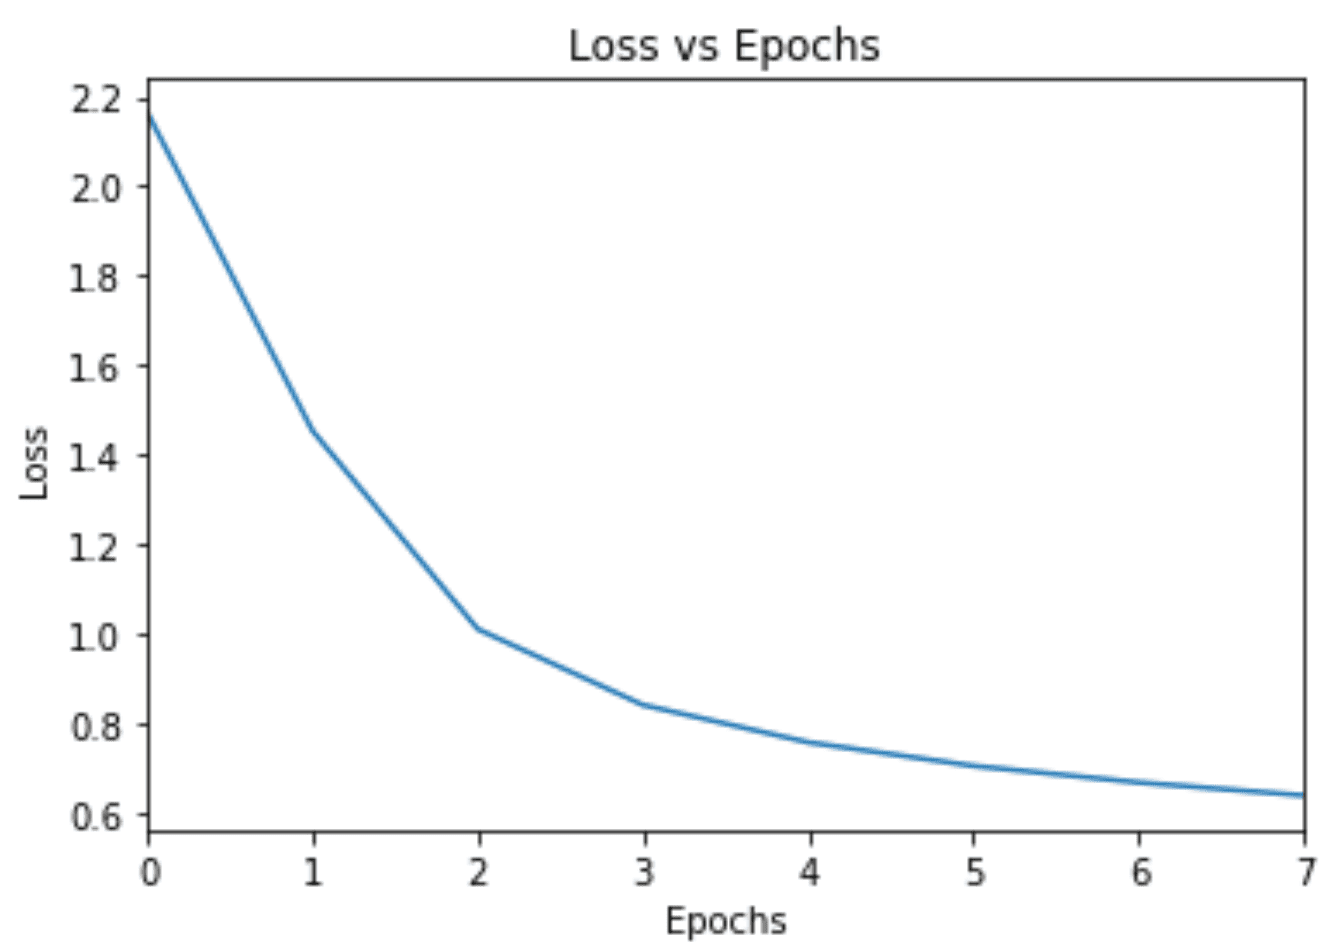
accuracy_plot = df.plot(y='accuracy', title="Accuracy vs Epoch", legend=False)
accuracy_plot.set(xlabel="Epochs", ylabel="Accuracy")
Plot MAE vs Epochs
Python
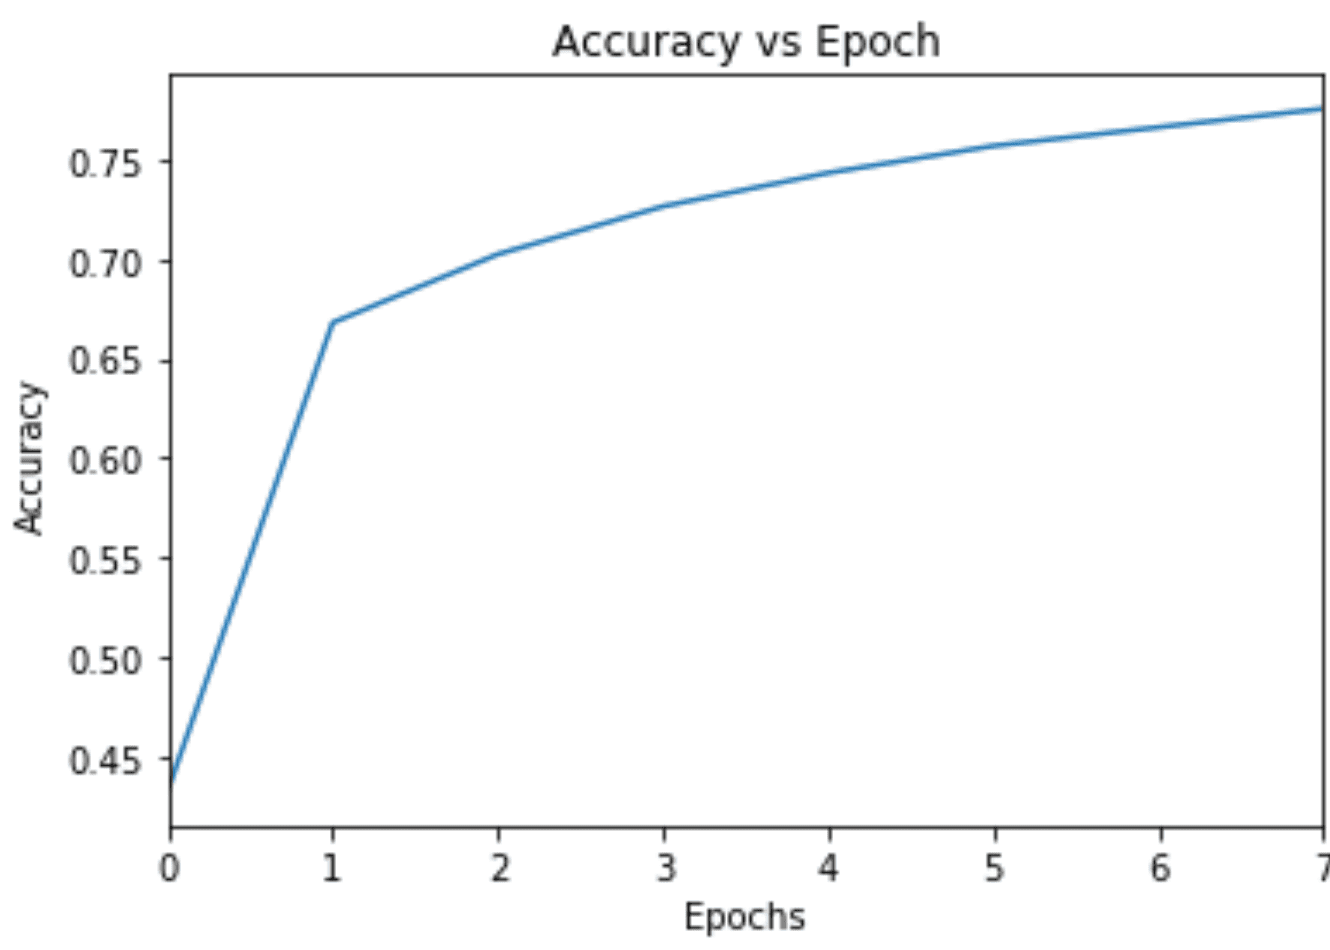
mae_plot = df.plot(y='mae', title='Mae vs Epochs', legend=False)
mae_plot.set(xlabel='Epochs', ylabel='MAE')